Flows & demand6 min read
How to read Bitcoin ETF flows
Learn how daily ETF net flows work, why fund columns come first, and why a missing report is not the same as a zero flow.
Crypto market research · Web and iOS
ETF flows, liquidations, open interest, funding, token unlocks and 20 on-chain indicators. Every page shows recent data, its source and time, and how to read it.
Numbers from the latest build snapshot. Each one opens the page with the full table, source and definition.
ETF flows
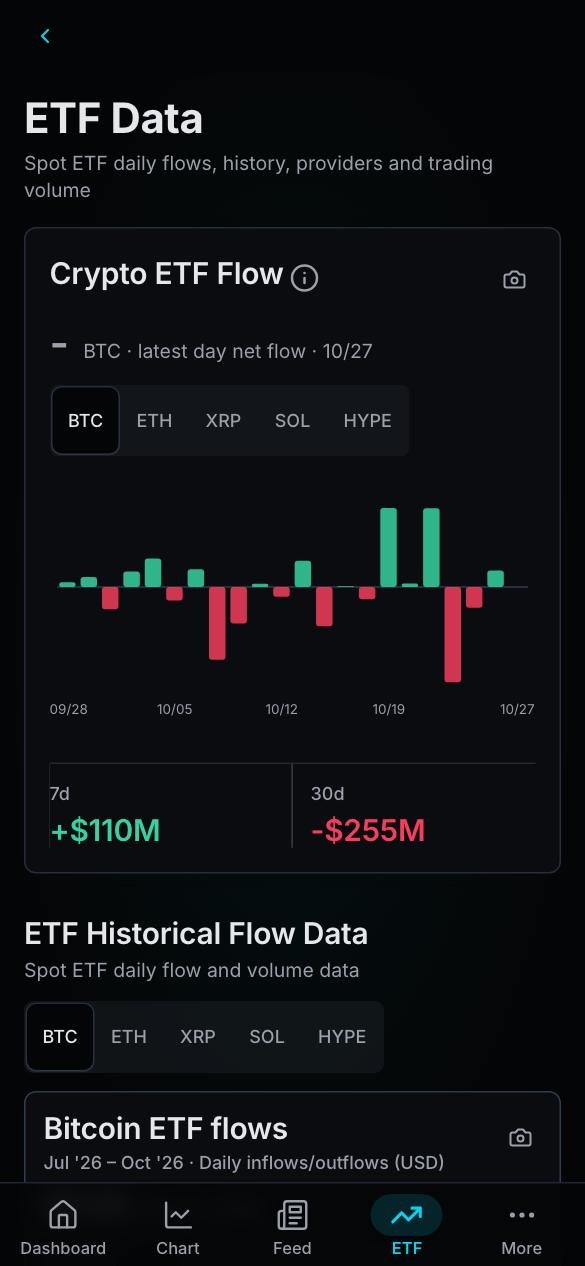
Daily net flows for Bitcoin, Ether, Solana, XRP and HYPE funds. Read the total next to each fund, and see days without a reported change instead of a false zero.
Bitcoin ETFs, daily net flow, last 60 trading days · 27 Oct 2026
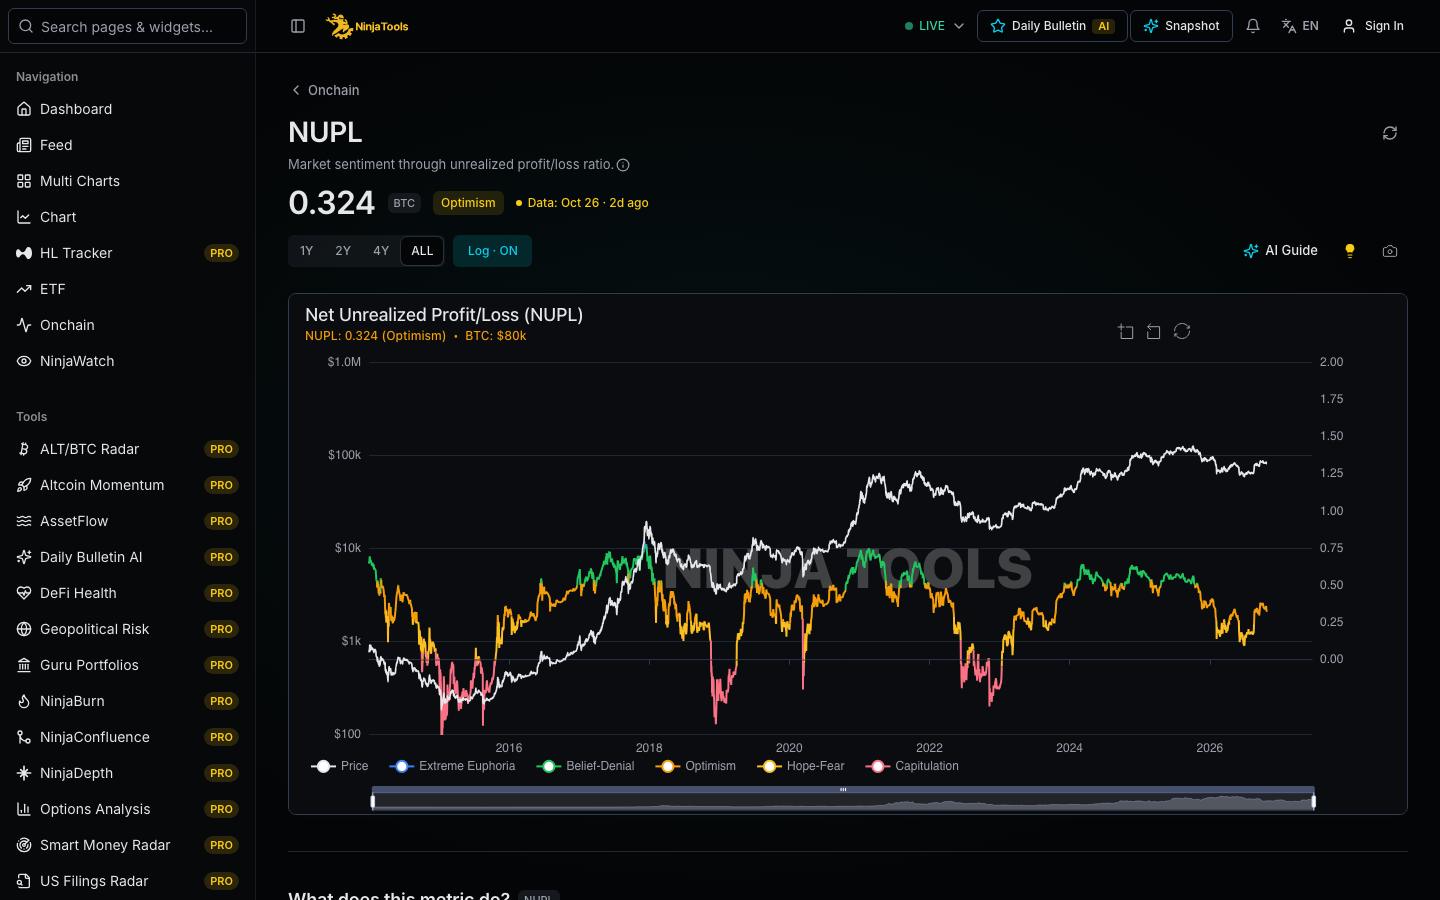
Valuation and profitability measures with full history, definitions and the price chart for context.
Every tool has a public page with an explanation. Data pages also show the latest numbers.
Long-form reading guides and a glossary, written for traders who check the definition first.
Learn how daily ETF net flows work, why fund columns come first, and why a missing report is not the same as a zero flow.
Coinbase Premium is a price gap between two venues. Learn how to read its sign, size and duration, and what it cannot tell you.
Open interest counts contracts that stay open. Volume counts contracts that trade. Learn the difference, the unit traps and how to read OI with price.
Liquidation data records reported forced closures. A heatmap models levels where closures could happen. Learn to read each with the right assumptions.
Wallet positions on Hyperliquid are public, but they are not a full portfolio. Learn what an address shows, what it hides and how to avoid common mistakes.
Learn what NUPL, MVRV, SOPR, Mayer Multiple and Puell Multiple measure, and why thresholds from past cycles are not rules.
NinjaTools is a crypto market research app for the web and iOS. It brings ETF flows, derivatives positioning, on-chain indicators, token unlocks and macro events into one workspace. These public pages show recent data and explain how to read it.
Yes. The Free plan includes the core data pages and up to 3 dashboard widgets. Premium adds research pages such as the Hyperliquid tracker, NinjaConfluence and options analytics. The pricing page lists access per tool.
Each data block names its source and shows when it was fetched. Sources include CoinGlass for derivatives, ETF and on-chain series, DefiLlama for stablecoins and token emissions, and company filings for Strategy purchases. The methodology page lists them.
Yes. NinjaTools is available on the App Store for iPhone and iPad. The app uses the same account, so Premium access follows you between the web and iOS where the purchase platform allows it.
No. NinjaTools provides data and explanations for research. A chart or indicator describes the market; it does not tell you what to buy or sell, and past behaviour does not guarantee future results.
Open the app for live views, alerts and your own dashboard.