What it shows
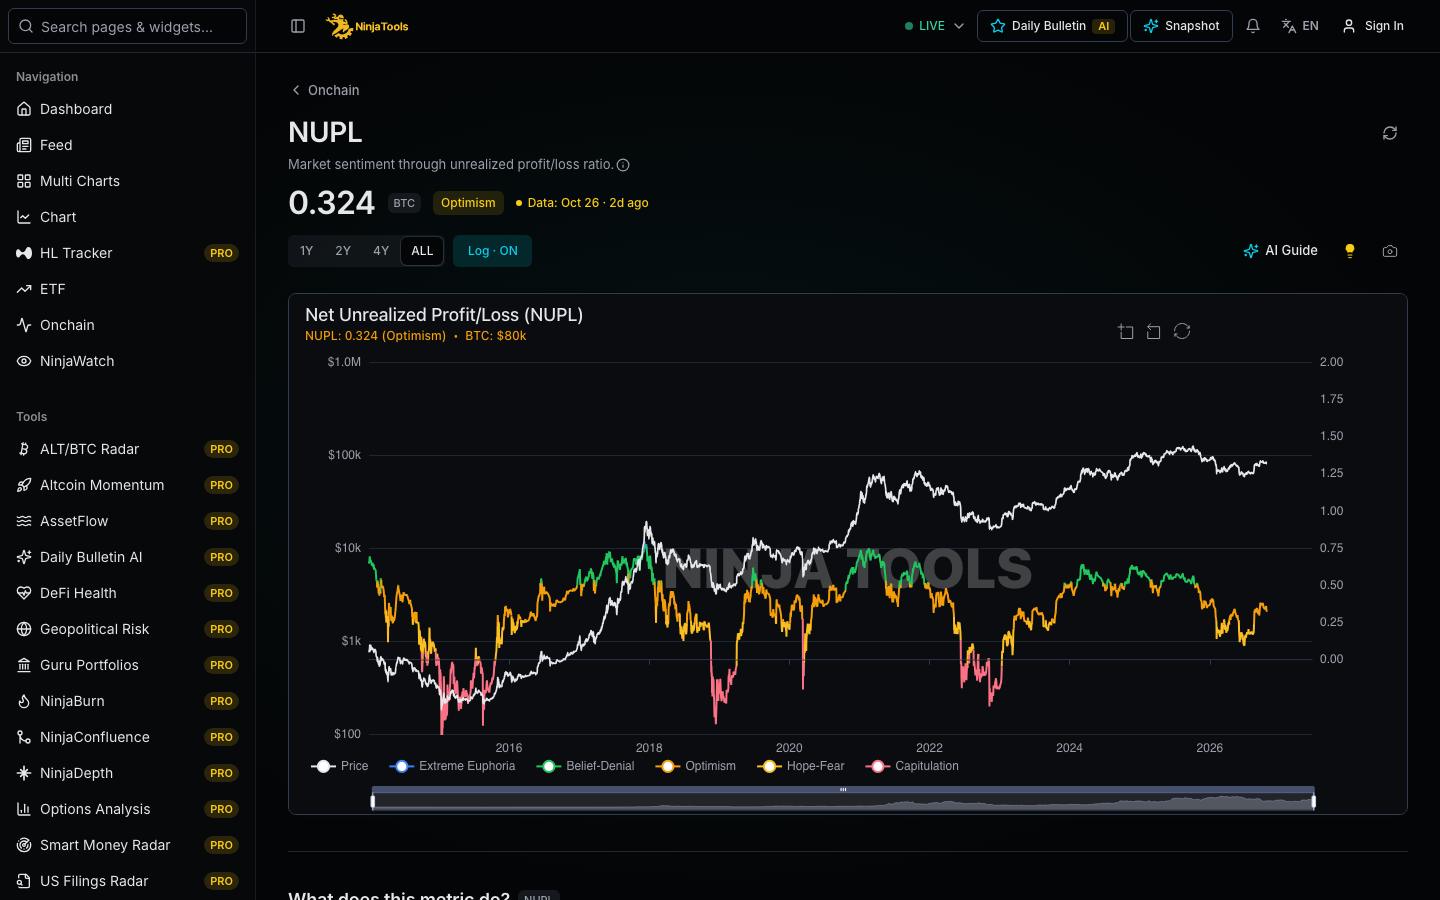
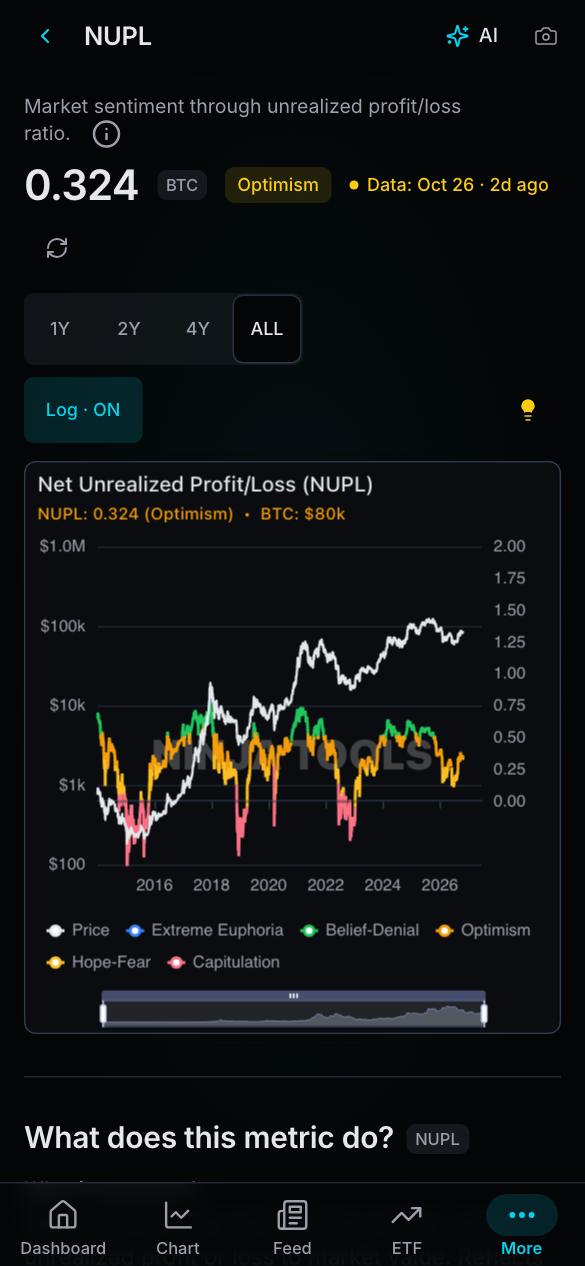
NUPL stands for Net Unrealized Profit/Loss. It compares the total unrealized profit or loss of all Bitcoin holders with the market value. A coin has an unrealized profit when its current price is above the price at its last on-chain move. It has an unrealized loss when the price is below that level. The standard formula is market capitalization minus realized capitalization, divided by market capitalization. A positive value means holders are in net profit. A negative value means they are in net loss. The chart shows the value in the upper panel and colors the line by value range. The BTC price is plotted for comparison.
- NUPL value panel
- Range-colored line
- BTC price comparison
How to read it
Read the latest value first. Then see which range it falls in. The app splits NUPL at 0, 0.25, 0.50 and 0.75. A value below 0 means holders are in net unrealized loss. A value above 0.75 is the highest range on this chart. In past cycles, readings in that range appeared near major price highs, and readings below 0 appeared near major lows. A reading in a range describes the present state only. Compare the line color with the BTC price to see how value and price moved together.
- Read the latest NUPL value and note its range.
- Check where the value crosses 0 on the chart.
- Compare past peaks and troughs with the BTC price line.
What to keep in mind
NUPL uses realized capitalization. That value treats every coin at the price of its last move. Lost coins and long-dormant coins stay in the base. The value can therefore differ from the real profit of active traders. The range names are fixed cut-offs chosen by the app. Each cycle has had different peak and trough values. Treat NUPL as one view of holder profit, not as a timing tool.
A missing value is not zero. Check the source and time under each data block before you compare numbers.
In the app
Questions
What is a good NUPL value?
There is no good or bad value. NUPL describes how much unrealized profit holders have. A high value means holders are in large profit. A low or negative value means small profit or a net loss. Each reading has a different meaning for each trader.
How is NUPL calculated?
NUPL equals market capitalization minus realized capitalization, divided by market capitalization. Market capitalization uses the current price. Realized capitalization values each coin at the price of its last on-chain move. The result is a ratio below 1.
What does a negative NUPL mean?
A negative NUPL means the market value is below the realized value. Holders are, in total, at an unrealized loss. The app marks this as the range below 0. Past market lows have appeared in this range, but a negative reading does not confirm a low.