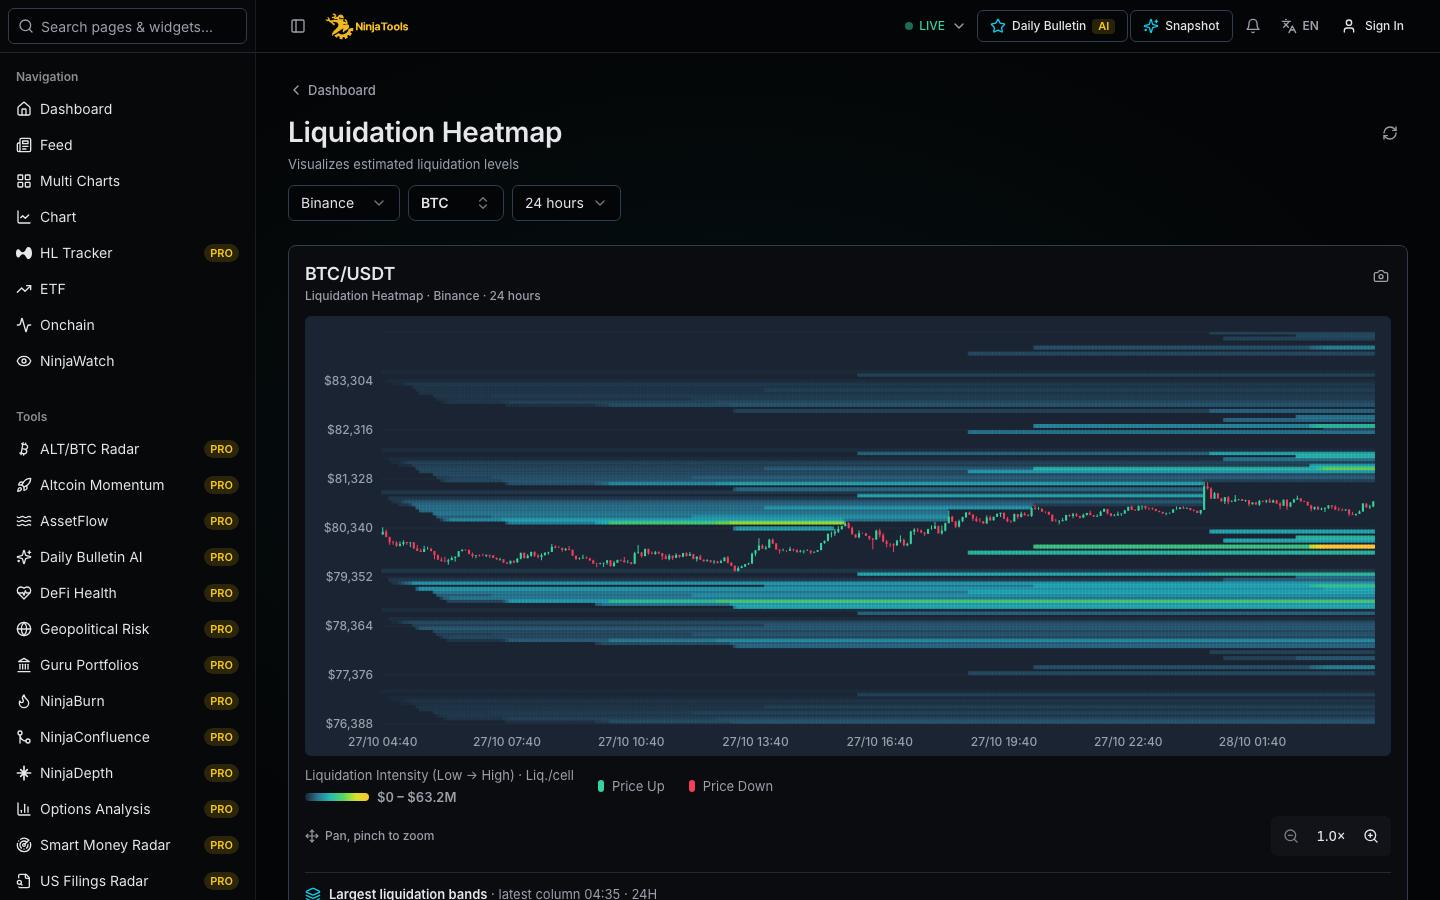
What it shows
A liquidation heatmap shows price levels where leveraged positions may be closed by force. The levels come from a model. The model estimates where positions opened at different prices would reach liquidation, and it adds up their size. The chart plots price on the vertical axis and time on the horizontal axis. Color shows the estimated amount at each level, from low to high intensity. You can choose the exchange, the coin and the time range. The page also lists dense levels above and below the current price, with cumulative amounts.
How to read it
First select the exchange, the coin and the time range. Find the current price line. Bright bands above it show estimated short liquidation levels. Bright bands below it show estimated long liquidation levels. Brighter color means a larger estimated amount. Then read the list of dense levels, which gives the price, the peak amount and the cumulative amount. Compare levels near the price with distant ones. A distant level needs a large price move before price can reach it.
- Choose the exchange, coin and time range.
- Locate the current price, then read the bright bands above and below it.
- Check the list of dense levels for price, peak and cumulative amount.
What to keep in mind
This is a model estimate, not a record of real positions. The model assumes common leverage levels and entry prices, but traders can add margin, reduce size or close positions before liquidation. Exchanges use different margin rules. Levels change as new positions open and old ones close. A dense level may attract price, or price may never reach it. The heatmap shows exposure, not the direction of price. Use the reported liquidation page to see what actually closed.
A missing value is not zero. Check the source and time under each data block before you compare numbers.
Questions
How is a liquidation heatmap calculated?
A model estimates it. The model takes open interest and the typical entry prices and leverage of positions, and it computes where those positions would be liquidated. It adds the sizes by price level. The result is an estimate. It is not an exchange record, and different providers can give different maps.
Do liquidation levels act as price targets?
No. A dense level shows where many leveraged positions are estimated to close, but price may never reach it. When price does reach a level, the forced orders add to trading at that point, which some traders watch. This is an observation of exposure. It is not a forecast.
Which coins and exchanges does the heatmap cover?
You can choose an exchange from Binance, Bybit, OKX and Hyperliquid. The coin list includes BTC, ETH, SOL, XRP and HYPE among others. Longer time ranges are available only for BTC and ETH. The list can change when data coverage changes.