What it shows
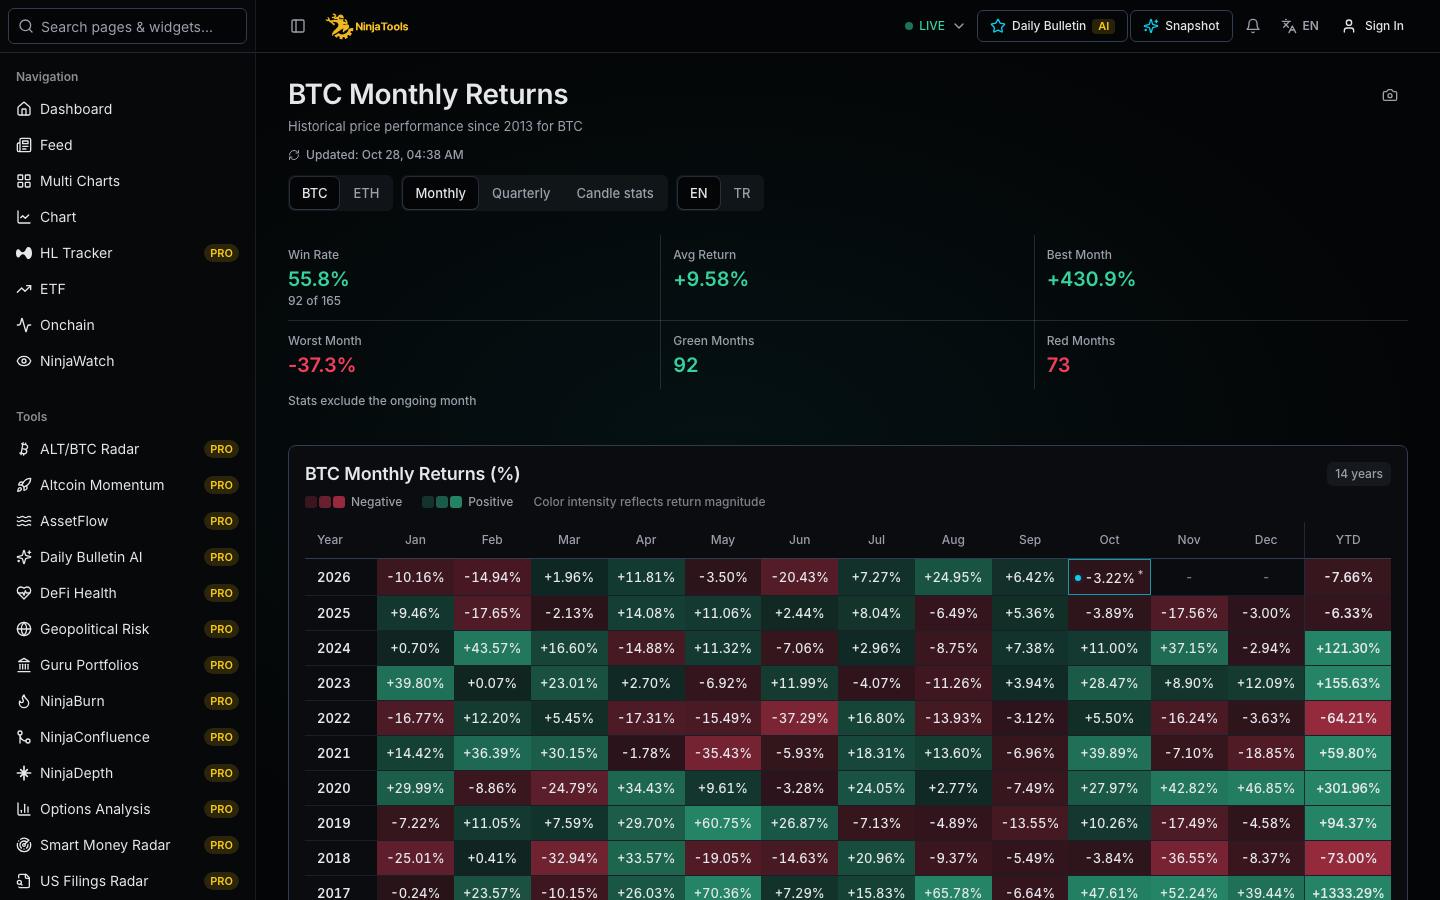
This view applies the monthly returns table to Ether, ETH. The Ether series starts in 2017, later than the Bitcoin series, so each month has fewer years behind it. Each row is a year and each column is a month. A cell is the change in US dollars from the open of the month to its close. Color encodes direction and magnitude. The summary strip shows the share of positive months, the average return, and the best and worst month. A quarterly view and a monthly price panel with open, high, low and close complete the page.
- ETH year by month table
- Average and median rows
- Quarterly view
- Monthly price panel
How to read it
Select Ether in the asset switch. Pick a month and read down its column. Because the series is shorter than the Bitcoin series, count how many years sit behind each average before you trust it. The footer rows give the average and the median, and they can differ when one year is extreme. The month in progress uses the latest price, so wait for the month to end before you compare it. Compare Ether with Bitcoin only as separate tables, since the two assets have different volatility.
- Select Ether and pick the month you want to study.
- Count the years behind each average before you rely on it.
- Leave the ongoing month out of comparisons until it closes.
What to keep in mind
The Ether history is short, so every monthly average rests on few observations and one year can set it. Returns are in US dollars and do not include fees, taxes, staking rewards or funding costs. A month in progress moves with price. Calendar months are an arbitrary split of time. Past monthly patterns can change, and the page does not forecast any future month.
A missing value is not zero. Check the source and time under each data block before you compare numbers.
In the app
Questions
How far back does the Ethereum monthly returns table go?
The Ether table starts in 2017, while the Bitcoin table starts in 2013. This means each Ether month has fewer years behind its average. Read the number of years per month before you use any average from this table.
Are Ether returns measured against Bitcoin?
No. The returns are the change in the US dollar price of Ether between the open and the close of the month. They do not show how Ether performed relative to Bitcoin. For a relative view, compare the Ether table with the Bitcoin table month by month.
Why is the current Ether month marked as ongoing?
The month has not closed, so the page cannot show a final return. It uses the open of the month and the latest price to give a running figure, and this figure moves with price. The summary statistics exclude the ongoing month, so they describe finished months only.