What it shows
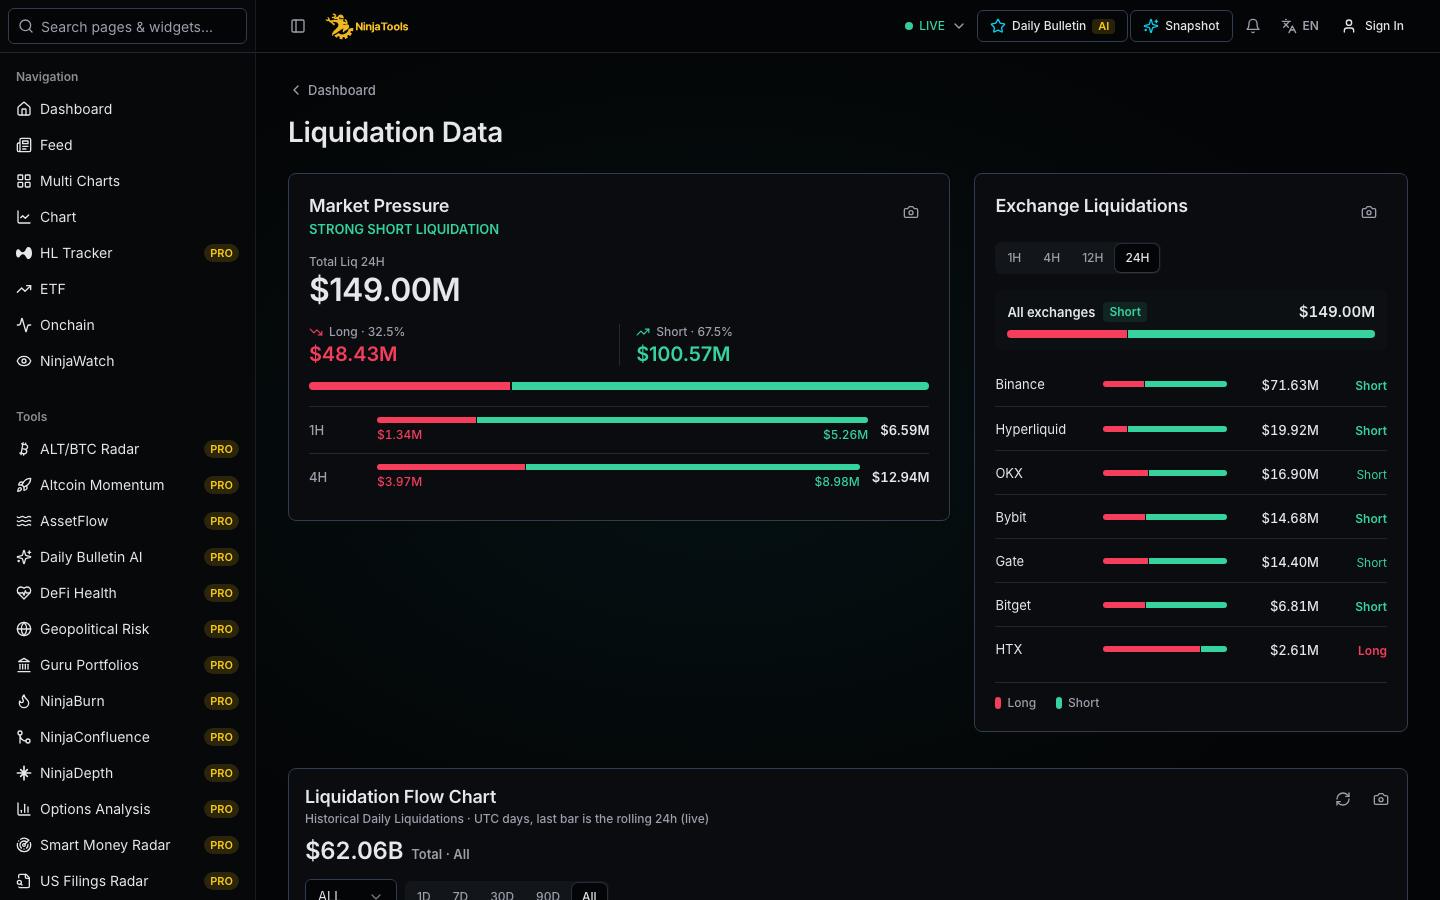
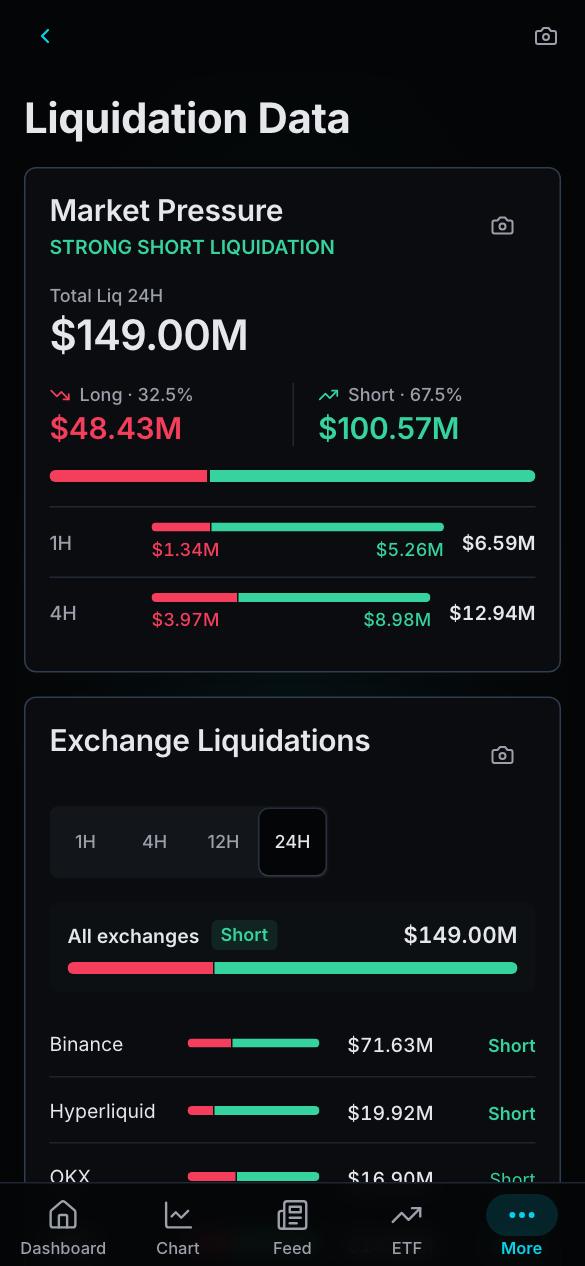
A liquidation happens when an exchange closes a leveraged futures position by force because the margin of the trader no longer covers the loss. This page shows reported liquidations on perpetual futures. You can choose a window of one, four, twelve or 24 hours. Totals are split into long and short positions. Tables show the same data by coin and by exchange, and a card shows the largest single liquidation of the last day. A flow chart and a daily history show how totals changed over time. A separate section covers perpetual contracts on metals.
- Long and short totals
- Table by coin
- Table by exchange
- Largest single liquidation
How to read it
Pick a window first. Then compare the long and short totals. A long liquidation means a long position was closed by force, which happens when price falls. A short liquidation is the reverse. The net bias shows which side lost more in that window. In the coin table, look for coins with unusual size for their market. In the exchange table, check whether the activity is spread across venues or sits on one. The largest single liquidation helps you tell one big position from many small ones.
- Select a window: 1h, 4h, 12h or 24h.
- Compare long and short totals, then read the net bias.
- Open the coin and exchange tables to see where the activity sits.
What to keep in mind
These are reported liquidations, meaning events that exchanges published. They are not forecasts of future liquidations, and they differ from the estimated levels on the heatmap page. Exchanges report in different ways, and some report only part of their events, so totals are lower bounds and not exact counts. Totals can lag the market. A large figure shows that forced closing happened. It does not show why price moved.
A missing value is not zero. Check the source and time under each data block before you compare numbers.
In the app
Questions
What does a long liquidation mean?
A long liquidation means an exchange closed a long position by force. This happens when price falls far enough that the margin of the trader can no longer cover the loss. The exchange sells the position to the market. A large long total in a short window usually follows a fast price drop.
Are liquidation totals complete?
No data source can promise a full count. Exchanges publish liquidation events in their own formats, and some send only a sample of orders in a short period. Treat totals as reported figures. They are useful for comparing windows and coins on the same basis, but not as an exact count of all forced closings.
What is the difference between liquidation data and a heatmap?
Liquidation data reports closings that already happened. A heatmap estimates price levels where leveraged positions could be closed, based on a model. One looks back and the other is a model of exposure. Use this page for what happened and the heatmap page for possible levels.