What it shows
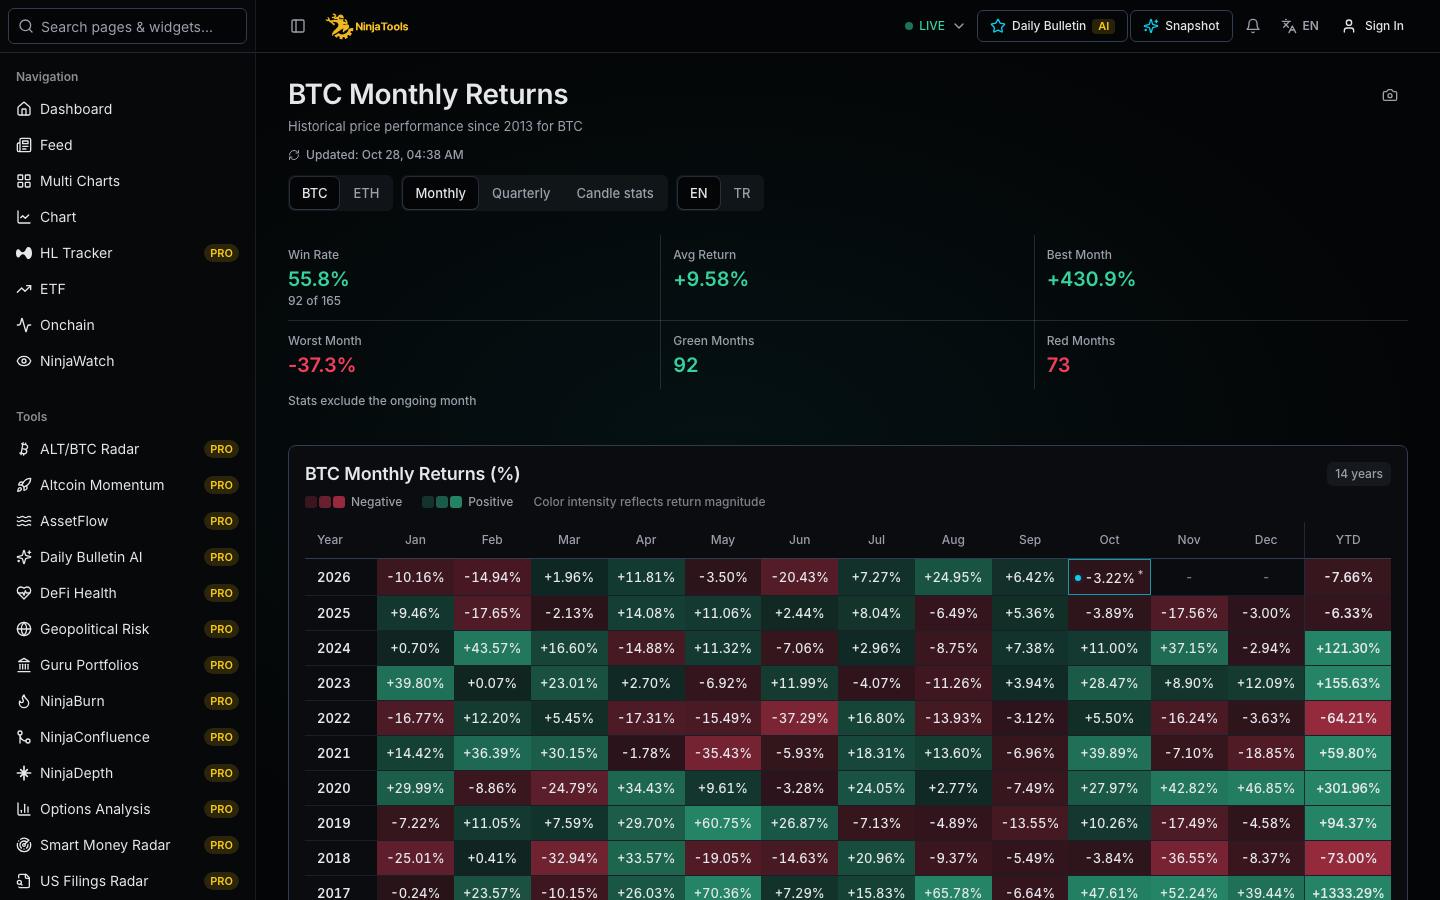
This page shows the percent change of Bitcoin for each calendar month since 2013. Each row is a year and each column is a month, so you can read one month across all years. A cell is the change from the first price of the month, the open, to the last price, the close. Colors show direction and size. The page adds a summary. It lists the share of positive months, the average return, the best and worst month and the count of positive and negative months. A quarterly view groups the same data by quarter. A panel lists open, high, low and close for each month of a year.
- Year by month table
- Win rate and averages
- Quarterly view
- Monthly open, high, low, close
How to read it
Find the month you want to study, such as October, and read down the column to compare years. Check the average and the median for that month in the footer rows. One extreme year can move an average, so look at the spread and at the count of positive months too. Treat the latest month with care: it has no final close yet. It uses the open of the month and the latest price, so it changes until the month ends, and the summary statistics leave it out. Use the closing price panel for the exact open and close of each month.
- Pick a month and read down its column to compare years.
- Check the average, median and count of positive months for that month.
- Treat the current month as partial and open the price panel for exact values.
What to keep in mind
Monthly returns describe the past. A month with a high average is built from a limited number of years, so one year can dominate it. Calendar months are an arbitrary split of time, and returns depend on the exact open and close time used. A month in progress changes with price. Returns do not include fees, taxes or funding costs. Seasonal patterns can change or vanish, and this page does not forecast any future month.
A missing value is not zero. Check the source and time under each data block before you compare numbers.
In the app
Questions
How is a Bitcoin monthly return calculated?
The return is the percent change from the open price of the month to its close price: close minus open, divided by open. For the current month, the page uses the latest available price in place of the close until the month ends. Fees and taxes are not included.
Which month is best for Bitcoin historically?
Read down the column of each month and check the average, median and count of positive years in the footer. Do not use one figure alone. Averages mix very different years, and a month with a strong average can still have many negative years. The table is a record, not a schedule.
Why is the current month different in the table?
The month has not ended, so its close does not exist yet. The page calculates a live figure from the open of the month and the latest price, and it marks the month as ongoing. This value changes with price. The summary statistics leave the ongoing month out, so they describe finished months only.