Skip to content
NinjaTools
Menu
Flows & demandFreeData on this page

Solana ETF flows: daily SOL fund net flows

Daily net flows of US-listed funds that hold SOL, with a short fund table, flow history and net assets. Read single-fund days with care.

Daily net flows

Latest reported day
-$19.20M

27 Oct 2026

Last 5 trading days
-$35.70M

1 day(s) without a reported change

Last 20 trading days
-$107.80M

1 day(s) without a reported change

Last 63 trading days
+$348.00M

30 Jul 2026 – 27 Oct 2026

-$100.0M-$50.0M0$50.0M$100.0M30 Jul 2026: no reported change31 Jul 2026: no reported change3 Aug 2026: no reported change4 Aug 2026: no reported change5 Aug 2026: no reported change6 Aug 2026: -$900.0K7 Aug 2026: no reported change10 Aug 2026: $8.8M11 Aug 2026: no reported change12 Aug 2026: no reported change13 Aug 2026: no reported change14 Aug 2026: no reported change17 Aug 2026: no reported change18 Aug 2026: $1.6M19 Aug 2026: $2.5M20 Aug 2026: $14.6M21 Aug 2026: $10.0M24 Aug 2026: $33.5M25 Aug 2026: $32.2M26 Aug 2026: $3.6M27 Aug 2026: $56.1M28 Aug 2026: $17.3M31 Aug 2026: $900.0K1 Sept 2026: $8.9M2 Sept 2026: -$6.1M3 Sept 2026: $6.4M4 Sept 2026: -$5.2M8 Sept 2026: -$700.0K9 Sept 2026: $11.2M10 Sept 2026: -$500.0K11 Sept 2026: -$300.0K14 Sept 2026: $11.0M15 Sept 2026: $1.3M16 Sept 2026: $800.0K17 Sept 2026: no reported change18 Sept 2026: $47.6M21 Sept 2026: $26.0M22 Sept 2026: $28.9M23 Sept 2026: $13.7M24 Sept 2026: $32.8M25 Sept 2026: $86.7M28 Sept 2026: $7.7M29 Sept 2026: $5.4M30 Sept 2026: -$12.5M1 Oct 2026: -$1.1M2 Oct 2026: $1.3M5 Oct 2026: -$9.2M6 Oct 2026: -$3.7M7 Oct 2026: -$4.8M8 Oct 2026: -$3.5M9 Oct 2026: -$3.8M12 Oct 2026: -$700.0K13 Oct 2026: -$1.0M14 Oct 2026: -$1.3M15 Oct 2026: -$9.8M16 Oct 2026: -$12.7M19 Oct 2026: -$6.7M20 Oct 2026: -$2.6M21 Oct 2026: $600.0K22 Oct 2026: -$8.9M23 Oct 2026: no reported change26 Oct 2026: -$8.2M27 Oct 2026: -$19.2M30 Jul14 Sept27 Oct
Daily net flow in USD. A thin grey mark means no fund reported a change that day; it is not shown as zero.
Last 15 trading days by fund (USD)
DateNet flowBSOLGSOLFSOLVSOLMSOLOther fundsSOL price
-$19.20M—-$19.20M————$101
-$8.20M-$7.20M-$1.80M——+$800.00K—$101
———————$104
-$8.90M-$5.70M-$3.20M————$107
+$600.00K————+$600.00K—$106
-$2.60M—-$2.60M————$105
-$6.70M-$4.90M—-$1.80M———$104
-$12.70M-$12.70M—————$105
-$9.80M-$3.80M-$6.00M————$104
-$1.30M-$1.30M—————$107
-$1.00M-$1.00M—————$106
-$700.00K———-$700.00K——$111
-$3.80M-$3.80M—————$110
-$3.50M-$5.30M———+$1.80M—$116
-$4.80M-$4.80M—————$121

SnapshotLive · data as of 27 Oct 2026 · Source: CoinGlass, collected by the NinjaTools ETF pipeline

Funds and net assets

Funds listed
8
Combined net assets
$1.49B

27 Oct 2026

Fund facts
FundNet assetsHoldingsShareFee
BSOL Bitwise$1.08B0 SOL72.4%—
FSOL Fidelity$204.83M0 SOL13.7%—
GSOL Grayscale$153.04M0 SOL10.3%—
VSOL VanEck$20.36M0 SOL1.4%—
SOEZ Franklin$14.84M0 SOL1.0%—
TSOL 21Shares$8.46M0 SOL0.6%—
QSOL Invesco$6.03M0 SOL0.4%—
SOLC Canary$3.89M0 SOL0.3%—

SnapshotLive · data as of 27 Oct 2026 · Source: CoinGlass, collected by the NinjaTools ETF pipeline

What it shows

This view covers US-listed funds that hold SOL, the token of the Solana network. It shows the daily net flow of the group, the flow of each fund and the net assets of each fund. The group is small compared with the Bitcoin group, so one issuer can account for most of a day’s total. Solana is a proof-of-stake network, and staking is a separate topic from the flow figure. The flow history shows how activity builds over time and lets you compare weeks.

  • SOL daily net flow
  • Per-fund flow table
  • Net assets and history

How to read it

Pick Solana in the asset switch. Read the daily total, then the fund table. With few funds, a single ticker often sets the sign of the total, so check each row. A newer fund can show zero before it gathers assets. A zero row is different from a missing report. Use the history chart to see whether flows are steady or arrive in single large days. Use the weekly or monthly view to reduce noise.

  1. Select Solana and read the latest daily net flow.
  2. Check each fund row, because one ticker can set the total.
  3. Use the weekly view to see if flows are steady or isolated.

What to keep in mind

A short fund list and a short history make the totals sensitive to one fund. The list of funds changes over time as issuers add products. Some funds may not report on every day, and an empty cell is unknown, not zero. SOL also trades on many venues outside the US, and ETF flows cover only the US funds. This page does not forecast price.

A missing value is not zero. Check the source and time under each data block before you compare numbers.

In the app
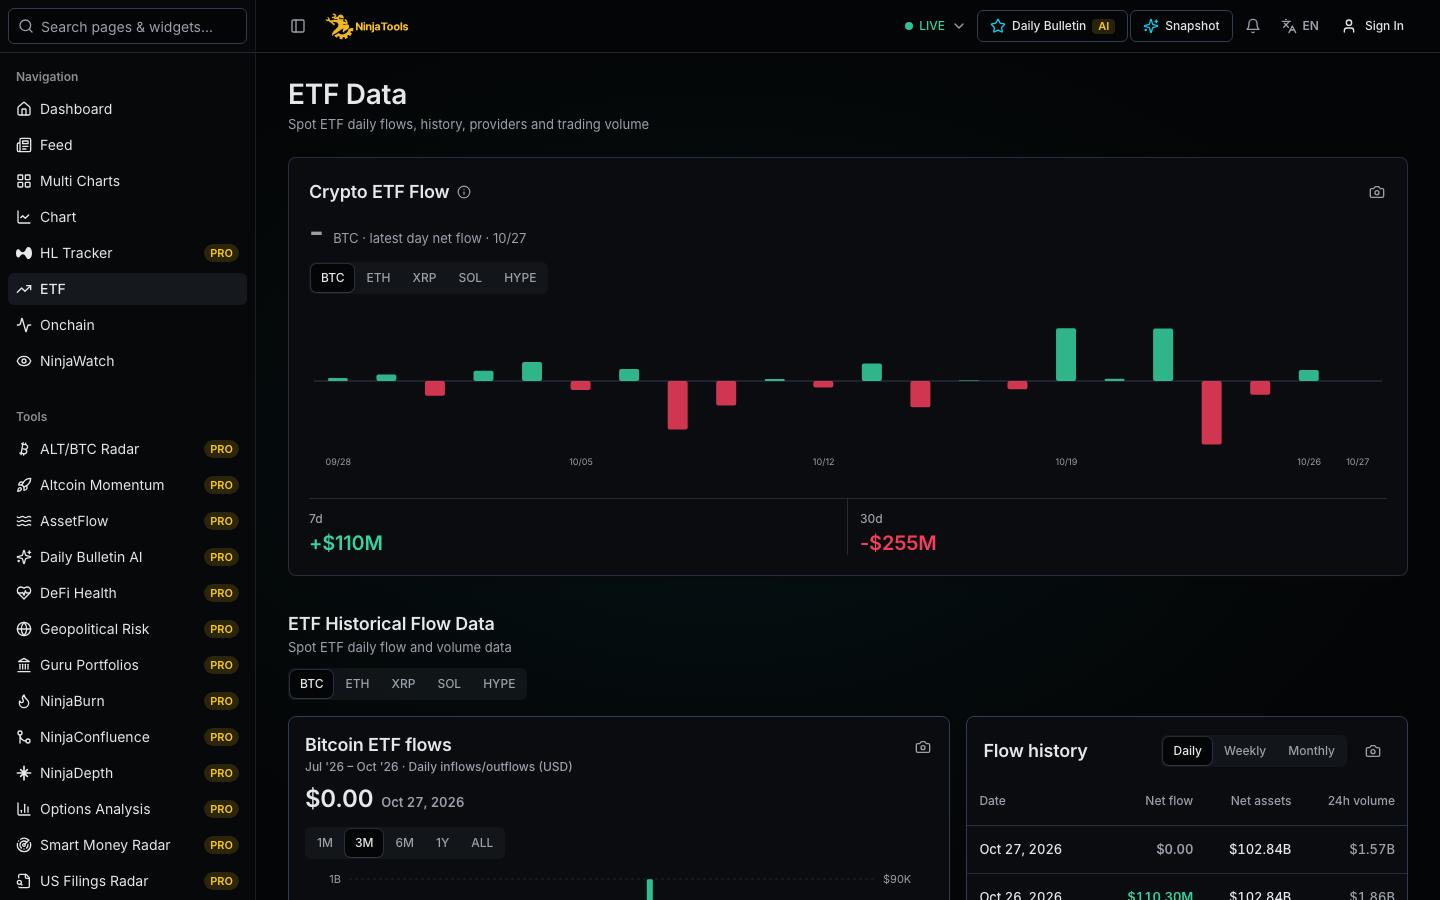
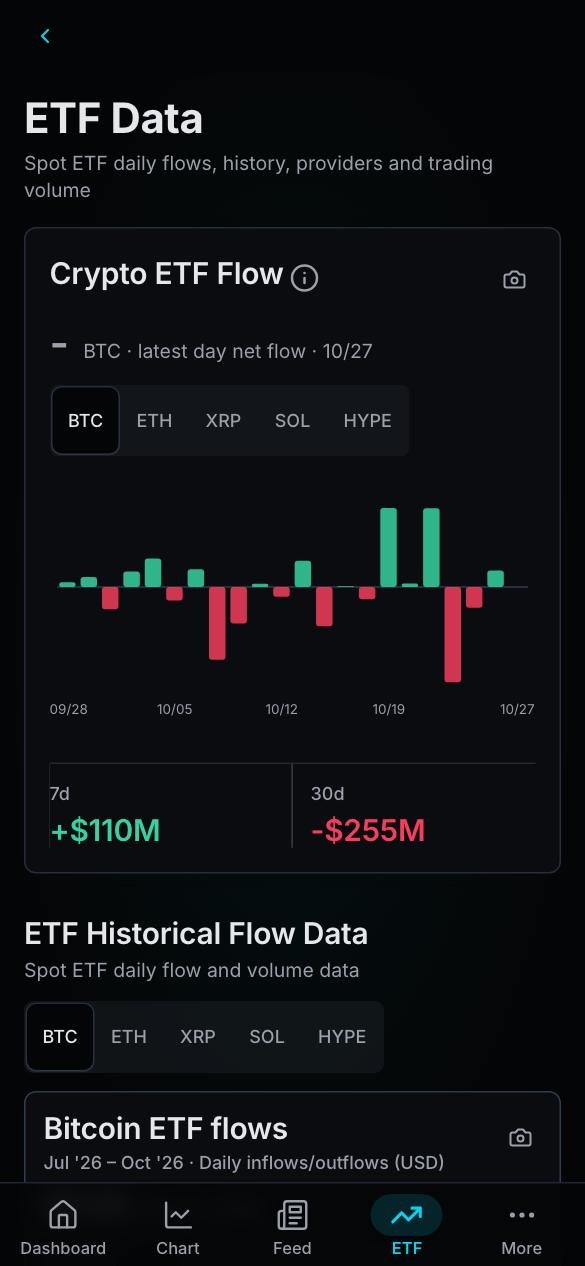
NinjaTools app: ETF flows
App screenshot ·
NinjaTools app: ETF flows
App screenshot ·

Questions

How many Solana ETFs are there?

The number changes as issuers launch or close products, so this page gives no fixed count. The fund table lists the tickers it tracks, such as BSOL and GSOL, with the issuer and the flow. Check that table for the current list. A short list means one fund can have a large effect on the total.

Can a Solana ETF show zero flow?

Yes. A fund can have no net creation or redemption on a day, which is a true zero. This is different from a missing report, where the data of the issuer is not yet available. Read an empty cell as unknown, and not as zero. Check the date of the latest update before you decide.

Are Solana ETF flows a signal for the SOL price?

Flows describe fund share activity in the US. SOL also trades on spot and derivatives venues around the world, and prices there reflect many other orders. A flow is one input, and it can arrive after price has already moved. Use it as context beside price, open interest and funding, and not as a forecast.

Build the wider view

Flows & demandFree

XRP ETF flows

Daily net flows of US-listed XRP funds by ticker, with flow history and net assets. Reporting can differ between funds, so check the date.

Latest reported day-$3.61M
Flows & demandFree

HYPE ETF flows

Daily net flows of US-listed funds that hold HYPE, the Hyperliquid token, with a short fund table, flow history and net assets.

Latest reported day-$4.30M
Flows & demandFree

Bitcoin ETF flows

Daily net flows of US spot Bitcoin ETFs, with a fund-by-fund table, flow history and net assets for funds such as IBIT, FBTC and GBTC.

Latest reported day+$176.00M
Open the appApp Store