Skip to content
NinjaTools
Menu
Flows & demandFreeData on this page

Bitcoin ETF flows: daily US spot fund net flows

Daily net flows of US spot Bitcoin ETFs, with a fund-by-fund table, flow history and net assets for funds such as IBIT, FBTC and GBTC.

Daily net flows

Latest reported day
+$176.00M

27 Oct 2026

Last 5 trading days
+$37.60M

every day reported

Last 20 trading days
-$175.90M

every day reported

Last 63 trading days
+$6.13B

30 Jul 2026 – 27 Oct 2026

-$1.0B-$500.0M0$500.0M$1.0B30 Jul 2026: $233.1M31 Jul 2026: -$265.4M3 Aug 2026: $170.1M4 Aug 2026: $211.5M5 Aug 2026: $244.4M6 Aug 2026: $137.6M7 Aug 2026: $101.7M10 Aug 2026: -$144.6M11 Aug 2026: $7.8M12 Aug 2026: -$61.1M13 Aug 2026: -$131.1M14 Aug 2026: -$56.2M17 Aug 2026: $297.5M18 Aug 2026: $189.3M19 Aug 2026: $517.2M20 Aug 2026: $606.3M21 Aug 2026: $307.5M24 Aug 2026: $337.6M25 Aug 2026: $314.3M26 Aug 2026: $232.2M27 Aug 2026: $242.3M28 Aug 2026: -$201.9M31 Aug 2026: $216.7M1 Sept 2026: -$236.5M2 Sept 2026: $101.1M3 Sept 2026: $730.8M4 Sept 2026: $174.6M8 Sept 2026: -$46.6M9 Sept 2026: -$120.2M10 Sept 2026: -$282.7M11 Sept 2026: -$13.2M14 Sept 2026: $159.9M15 Sept 2026: -$450.4M16 Sept 2026: -$295.9M17 Sept 2026: $159.5M18 Sept 2026: $433.0M21 Sept 2026: $999.0M22 Sept 2026: $714.7M23 Sept 2026: $346.9M24 Sept 2026: $190.7M25 Sept 2026: $134.5M28 Sept 2026: $31.0M29 Sept 2026: $66.2M30 Sept 2026: -$148.7M1 Oct 2026: $102.7M2 Oct 2026: $189.9M5 Oct 2026: -$89.8M6 Oct 2026: $118.8M7 Oct 2026: -$484.9M8 Oct 2026: -$244.1M9 Oct 2026: $21.1M12 Oct 2026: -$65.4M13 Oct 2026: $175.7M14 Oct 2026: -$261.4M15 Oct 2026: $5.1M16 Oct 2026: -$82.4M19 Oct 2026: $526.7M20 Oct 2026: $23.2M21 Oct 2026: $524.8M22 Oct 2026: -$635.6M23 Oct 2026: -$137.9M26 Oct 2026: $110.3M27 Oct 2026: $176.0M30 Jul14 Sept27 Oct
Daily net flow in USD. A thin grey mark means no fund reported a change that day; it is not shown as zero.
Last 15 trading days by fund (USD)
DateNet flowIBITFBTCARKBGBTCBITBOther fundsBTC price
+$176.00M+$151.50M+$24.50M————$80,116
+$110.30M+$110.30M—————$80,114
-$137.90M-$110.30M-$31.80M———+$4.20M$81,385
-$635.60M-$254.10M-$217.50M-$109.40M-$29.50M-$27.40M+$2.30M$84,050
+$524.80M+$235.00M+$212.70M+$9.80M+$32.60M+$19.20M+$15.50M$82,985
+$23.20M+$29.90M+$3.60M——-$10.30M—$81,903
+$526.70M+$665.20M-$83.60M—-$54.90M——$82,078
-$82.40M-$71.80M-$10.60M————$82,195
+$5.10M+$16.80M————-$11.70M$81,642
-$261.40M-$110.90M-$152.70M——+$2.20M—$83,126
+$175.70M+$65.90M+$103.10M———+$6.70M$81,814
-$65.40M-$65.40M—————$83,723
+$21.10M+$22.40M-$3.60M———+$2.30M$81,711
-$244.10M-$5.50M-$197.10M-$20.30M-$8.20M-$17.70M+$4.70M$83,282
-$484.90M-$207.70M-$105.10M-$101.70M-$39.30M-$27.60M-$3.50M$85,508

SnapshotLive · data as of 27 Oct 2026 · Source: CoinGlass, collected by the NinjaTools ETF pipeline

Funds and net assets

Funds listed
12
Combined net assets
$103.67B

27 Oct 2026

Fund facts
FundNet assetsHoldingsShareFee
IBIT BlackRock$65.50B813,040 BTC63.0%0.25%
FBTC Fidelity$14.03B176,513 BTC13.5%0.25%
GBTC Grayscale$10.11B125,257 BTC9.7%1.5%
BTC Grayscale Mini$5.02B61,745 BTC4.8%0.15%
BITB Bitwise$2.99B37,085 BTC2.9%0.2%
ARKB Ark & 21Shares$2.46B30,712 BTC2.4%0.21%
HODL VanEck$1.18B14,752 BTC1.1%—
MSBT Morgan Stanley$870.55M10,866 BTC0.8%—
BRRR Valkyrie$472.12M5,655 BTC0.5%0.25%
EZBC Franklin$463.17M5,781 BTC0.4%0.19%
BTCO Invesco$411.95M5,162 BTC0.4%0.39%
BTCW WisdomTree$167.62M2,063 BTC0.2%0.3%

SnapshotLive · data as of 27 Oct 2026 · Source: CoinGlass, collected by the NinjaTools ETF pipeline

What it shows

A spot Bitcoin ETF holds real bitcoin and issues shares that trade on a US stock exchange. When investors buy more shares than they sell, the fund creates new shares and buys bitcoin. This is a net inflow. When selling dominates, shares are redeemed and the fund sells bitcoin. This is a net outflow. This page shows the total net flow of all US spot Bitcoin ETFs for each trading day. A fund table splits that total by issuer, such as IBIT, FBTC and GBTC. The page also shows the net assets of each fund and the history of the total.

  • Daily net flow chart
  • Fund-by-fund table
  • Net assets per fund
  • Flow history views

How to read it

Start with the daily total. Then open the fund table to see which issuers make up that total. One issuer can have large inflows while an older fund has outflows, and the total shows only the difference. Next, read the history chart to see whether the latest day fits the recent sequence. Compare a flow with the net assets of the fund to judge its relative size. Use the views from one month to the full range to change the window. Switch between daily, weekly and monthly sums when daily values are noisy.

  1. Read the latest daily net flow and note its reporting date.
  2. Open the fund table and compare the issuers that make up the total.
  3. Check the history chart to see how the latest day fits the recent days.

What to keep in mind

US funds report after the market closes, so the table shows finished trading days and not live demand. A missing report is not a zero flow. The total can hide offsetting moves between funds. A flow counts the creation and redemption of shares. It does not explain why investors acted. ETF flows are one input beside spot, derivatives and on-chain data. They do not predict price.

A missing value is not zero. Check the source and time under each data block before you compare numbers.

In the app
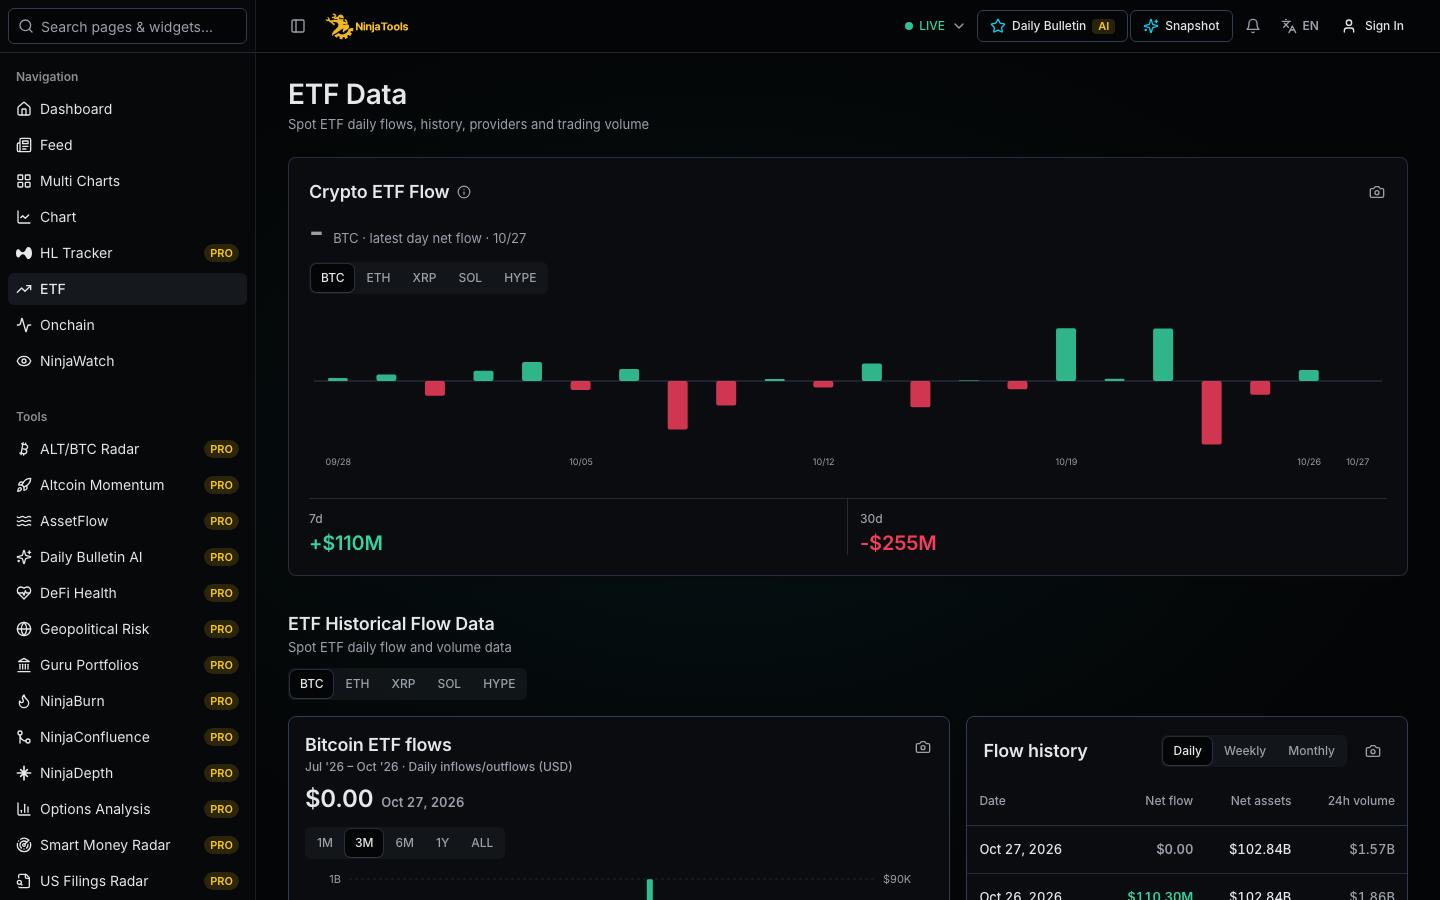
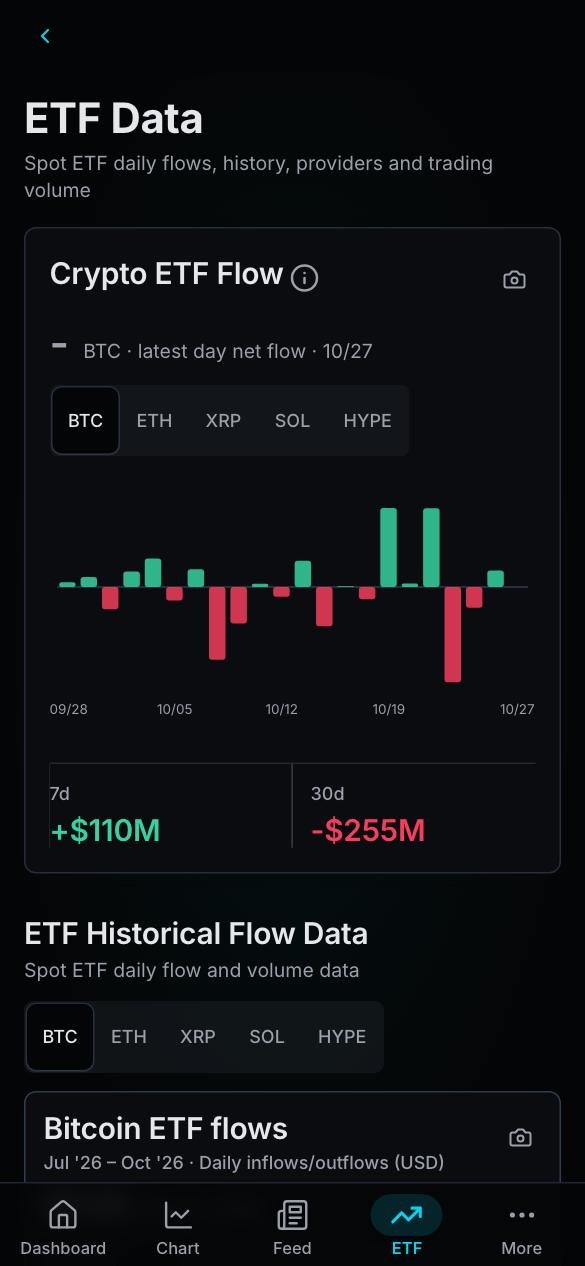
NinjaTools app: ETF flows
App screenshot ·
NinjaTools app: ETF flows
App screenshot ·

Questions

What does a Bitcoin ETF outflow mean?

An outflow means that, on that trading day, more shares were redeemed than created. To pay investors, the fund sells bitcoin. The figure shows the net direction of share activity. It does not show why holders sold or what price will do next.

Which funds are in the Bitcoin ETF table?

The table lists US-listed spot Bitcoin funds by ticker, such as IBIT, FBTC and GBTC, with the issuer, the daily flow and the net assets. Futures-based funds are left out of the provider breakdown. The set of funds can change when issuers add or close products, so read the table on the page for the current list.

How often are Bitcoin ETF flows updated?

US spot ETFs report once per trading day, after the market closes. The page updates its daily figures from these reports. Weekends and US market holidays have no new trading day, so no new flow appears. A missing value for a day means the data is not reported yet. It does not mean zero.

Build the wider view

Flows & demandFree

Ethereum ETF flows

Daily net flows of US spot Ether ETFs, with a table by fund, the history of flows and the net assets of each fund. Staking is a separate topic.

Latest reported day-$60.20M
Flows & demandFree

Coinbase Premium

The percentage gap between the Bitcoin price on Coinbase and a global average price, shown through time for intervals from five minutes to one day.

Premium history chart · Interval selector
DerivativesFree

Open interest

Open interest of futures and perpetuals by exchange for BTC, ETH and other coins, in USD and coin units, with 1h, 4h and 24h changes.

BTC open interest$54.60B
Open the appApp Store