What it shows
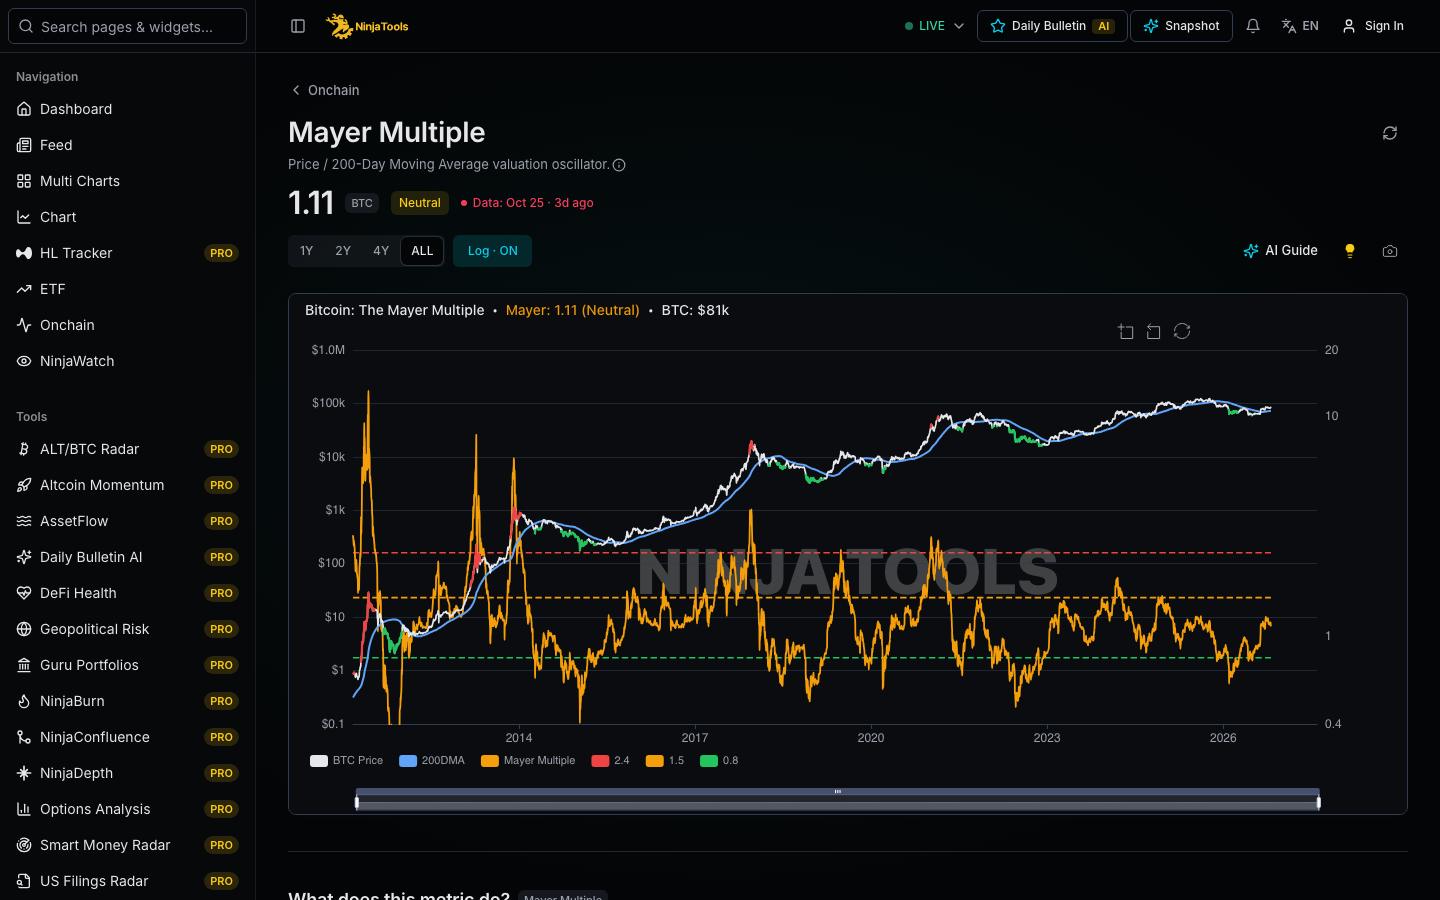
The Mayer Multiple is a ratio. It divides the Bitcoin price by the 200-day simple moving average of the price. A value of 1.0 means the price equals its 200-day average. A value above 1.0 means the price is above the average. A value below 1.0 means the price is below it. The ratio shows how far the price has moved away from its long-term trend. The chart has two panels. One panel plots the ratio. The other panel plots the BTC price with the 200-day average. The app calculates the ratio from daily prices. The first value appears after 200 days of price data exist.
- Mayer ratio panel
- 200-day average line
- 0.8, 1.5, 2.4 reference lines
How to read it
Start with the latest ratio and compare it with 1.0. Then check the reference lines. The app uses 0.8 and 2.4 as the edges of its low and high ranges. A dashed line at 1.5 is a middle reference. A reading above 2.4 means the price is far above its 200-day average. A reading below 0.8 means the price is well below it. In past cycles, the ratio reached high and low readings near major turns. This does not predict the next move. Compare the current value with earlier peaks and troughs on the same chart.
- Read the latest ratio and compare it with 1.0.
- Check whether the ratio sits near the 0.8 or 2.4 line.
- Compare the BTC price with the 200-day average on the lower panel.
What to keep in mind
The ratio depends on one fixed window of 200 days. Price size and market structure have changed across cycles. Early readings came from a much smaller market. The ratio uses price only. It does not include volume, on-chain data or news. Reference lines mark past reading ranges. They are not rules. Use this chart as context next to other tools.
A missing value is not zero. Check the source and time under each data block before you compare numbers.
In the app
Questions
How is the Mayer Multiple calculated?
Divide the current Bitcoin price by the 200-day simple moving average of the price. The moving average adds the last 200 daily prices and divides the sum by 200. If the price is 1.5 times its average, the Mayer Multiple is 1.5.
What is a high Mayer Multiple?
A high value means the price is far above its 200-day average. This page marks readings above 2.4 as its high range. Past cycle highs came with high readings, but a high reading alone does not say when a trend ends.
Is the Mayer Multiple a buy or sell signal?
No. The Mayer Multiple describes the distance between price and a moving average. It is a context tool. It does not give trade instructions, and it does not predict future price. Combine it with other data and your own risk plan.