What it shows
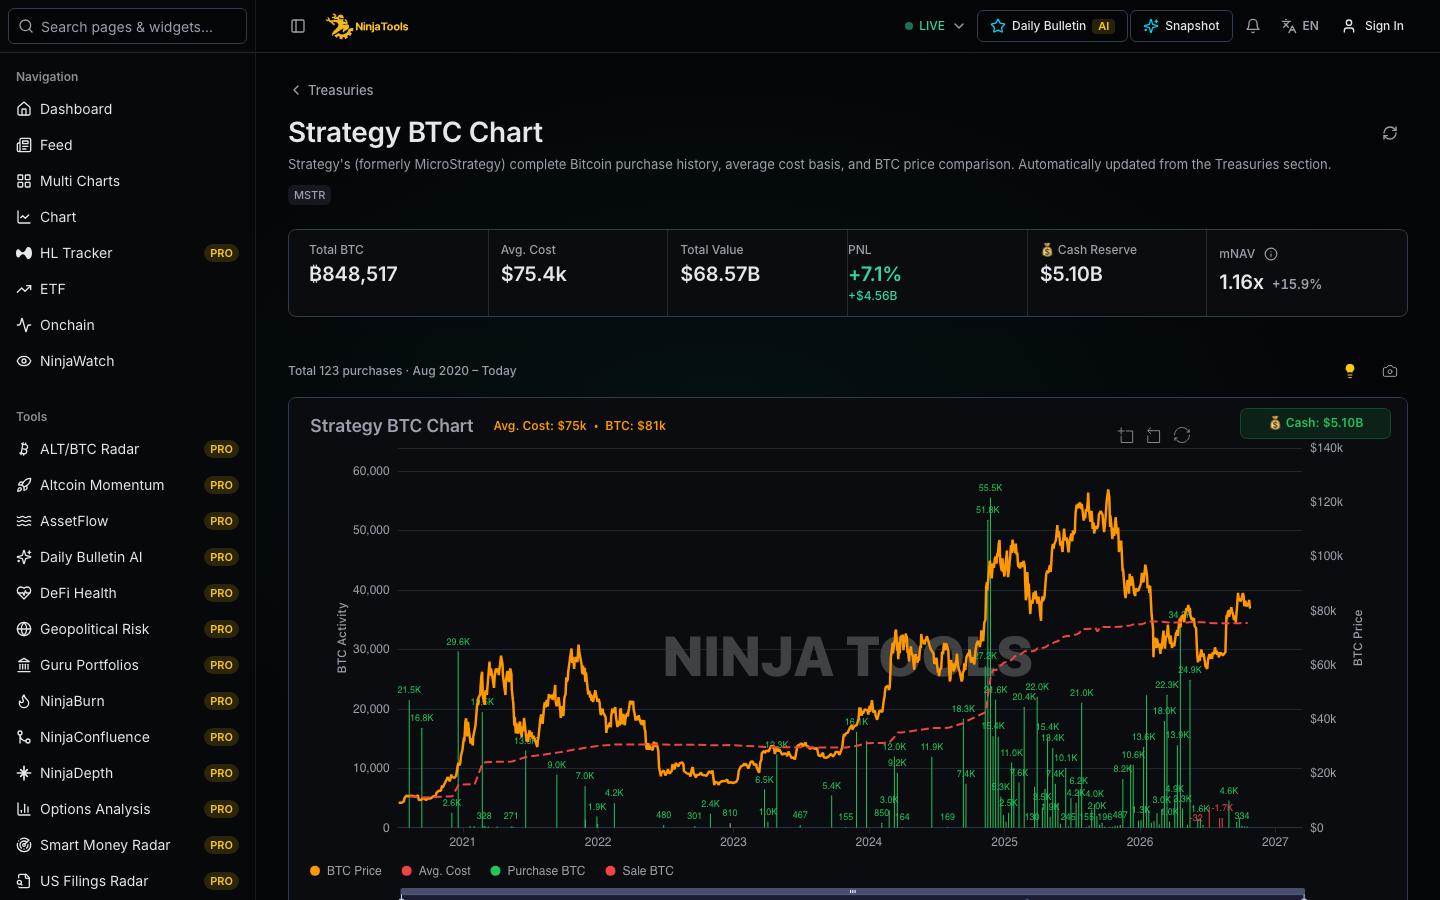
Strategy, formerly MicroStrategy, is a US-listed company that holds bitcoin as a treasury asset. This page lists its Bitcoin purchase history. Each entry has a date, the amount of BTC bought and the cost of that purchase. It also has the running totals: total BTC held, total cost and average cost per BTC. A chart places the purchases beside the BTC price and the average cost line. The page also shows the value of the holding at the current BTC price and the profit or loss against average cost. Sales, if any, appear as separate events.
- Purchase-by-purchase history
- Total BTC and average cost
- Purchases beside BTC price
- mNAV and cash reserve
How to read it
Read the summary first: total BTC, average cost and total value. Average cost is total cost divided by total BTC held, so a new purchase moves it only by the weight of that purchase. In the chart, bar height shows the BTC amount of each purchase. If the BTC price line is above the average cost line, the holding is above its cost at that price. If it is below, the holding is below its cost. The page also shows cash reserve and mNAV, which compares the market value of the company with the value of its bitcoin.
- Read total BTC, average cost and total value in the summary.
- Find the tallest bars in the chart and match them with dates.
- Compare the BTC price line with the average cost line.
What to keep in mind
Purchase records come from company filings, so a purchase appears after it is disclosed and not when it happens. Average cost is a weighted average of the reported purchase costs. A profit or loss figure uses the current BTC price and changes with it. mNAV depends on the market value of the shares and on how the reserve is valued. How the company funds purchases is a separate topic. The page gives no advice on the company shares.
A missing value is not zero. Check the source and time under each data block before you compare numbers.
In the app
Questions
How many bitcoin does Strategy own?
The summary at the top of the page shows the total BTC from the latest recorded purchase. It also shows the total cost and the average cost per BTC. The figure updates when a new purchase is added from company filings. Read the date of the last purchase to know how current it is.
How is the average cost per bitcoin calculated?
Average cost is the total cost paid for all bitcoin held divided by the total number of bitcoin held. When the company buys at a price above the average, the average rises. When it buys below the average, the average falls. The chart draws this running figure as a line.
What is mNAV on the Strategy page?
mNAV is the market value of the company divided by the net asset value of its bitcoin holding. A value above one means the shares trade at a premium to the bitcoin they hold. A value below one means a discount. It describes how the market prices the shares. It is not advice on them.